デジタルデトックスのその先。⑤「家Wi-Fi接続時間測定」+「Wi-Fi/PC使用時間統計」アプリケーション
はじめに
今日今までどれくらいWi-Fiを使ったのかがわからず、賭けに出て検索や通販を行なった結果、Wi-Fiが使えなくなって途中で作業が途切れてしまうということも多い。前回の記事では少しの時間だけWi-Fiをオンにできるようにしたが、そもそも使用した時間が表示できるようになっていれば、あと何分インターネットを使えるかわかるので間違いが起こりづらくなる。
そのため、対策として「今日一日家のWi-Fiに繋がっていた時間を測る」アプリケーションを作り、いつでも確認できるようにした。
また、この時間をデータとして残し、グラフ化して、いつどれくらいWi-Fiを使ったか自覚できるようにもしたい。どういう時に使ってしまうから1日のインターネット使用可能時間が減ってしまうのかであったり、平日と休日での使用時間の違いであったり、使用傾向がわかると行動の仕方を変える指標として使うことができる。加えて、Wi-Fiと同時にPC全体の使用時間も測定し、併せてグラフ化することで、どんな用途でパソコンを使っているのかもある程度知ることができるようになる。
そこで「Wi-Fi・PCの使用時間推移をグラフ化する」アプリケーションを作り、オンライン/オフライン、時間帯別、日別でデータを見比べられるようにした。
2つは別のアプリであるが、お互いの連携が必要なため一緒に説明を行う。
どんなものができるか

Wi-Fiの使用時間をメニューバーで確認できるアプリ。
1日ごとにリセットされる。手動でリセットも可能。

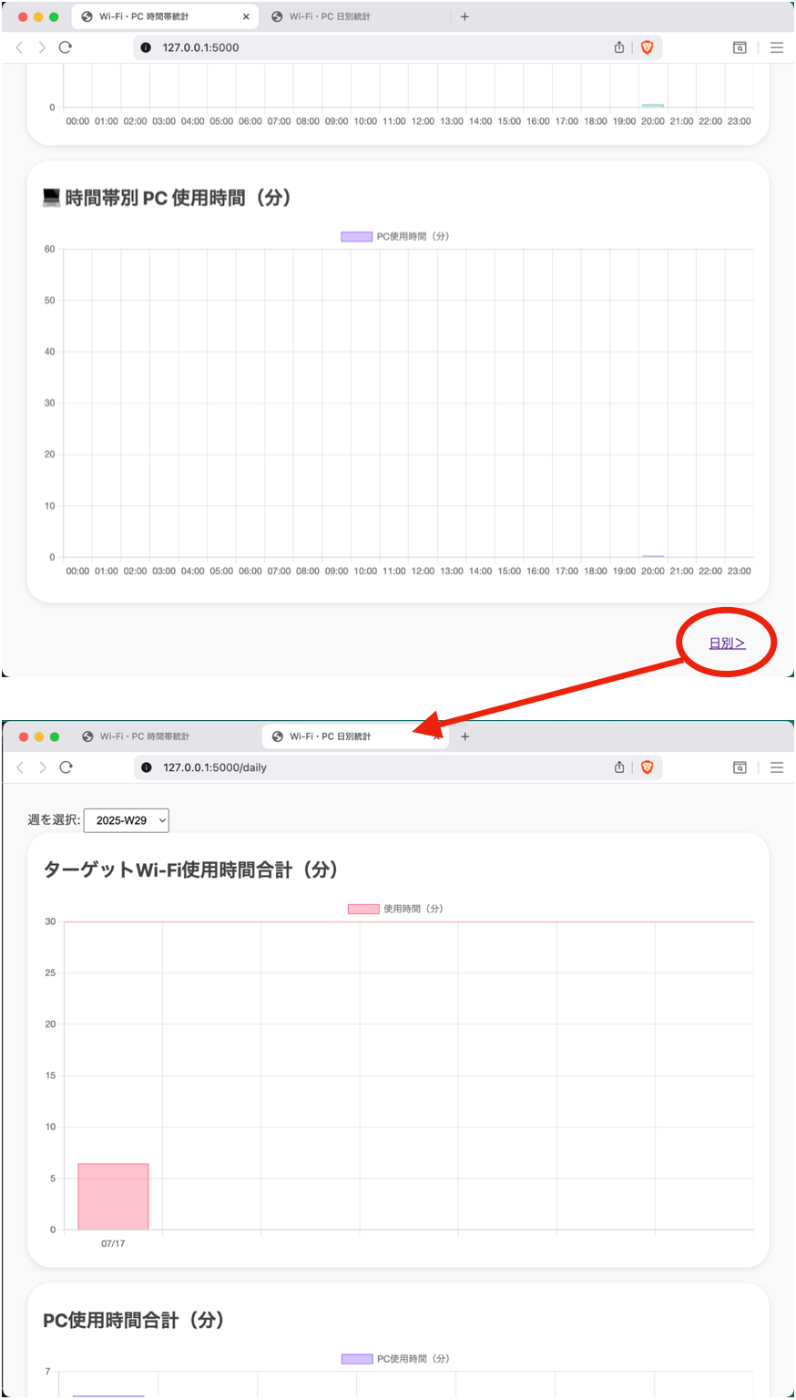
時間帯ごとのWi-Fi・PC使用時間を棒グラフで表示するwebアプリ。
日付を選択して、過去の記録を遡ることもできる。

日ごとのWi-Fi・PC使用時間合計を1週間分棒グラフで表示するwebアプリ。
同じく週を選択して、過去の記録を遡ることもできる。
ディレクトリ構成
wifi_usage_tracker/
├── wifi_timer.py                # Wi-Fi利用時間を記録(①)
├── wifi_icon.png                # ①に使うメニューバーアイコン
├── wifi_usage.log               # ①に使う時間記録場所
├── pc_usage_logger.py           # PC点灯時間を記録(②)
├── screen_awake.flag            # ②に使うsleepwatcher用フラグ
├── logs/
│   ├── 2025-07-12.csv           # ①の時間帯別Wi-Fi利用時間記録保管
│   ├── 2025-07-13.csv
│   ├── pc_2025-07-12.csv        # ②の時間帯別PC点灯時間記録保管
│   ├── pc_2025-07-13.csv
│   └── ...(他の日付ファイルは省略)
└── webapp/
    ├── app.py             # グラフ表示webアプリ本体(③)
    └── templates/
        ├── hourly.html          # ③に使う時間帯別表示ページの構成
        └── Daily.html           # ③に使う日別表示ページの構成
「家Wi-Fi接続時間測定」アプリケーション実装手順
wifi_timer.py
- ユーザーディレクトリに「wifi_usage_tracker」という名前のフォルダを作る。
- Pythonスクリプトを書く。家のWi-FiSSIDを該当箇所に入力する(theBeatlesのところ)。
import sys
import os
import time
import subprocess
from PyQt5.QtWidgets import QApplication, QSystemTrayIcon, QMenu, QAction
from PyQt5.QtGui import QIcon
from PyQt5.QtCore import QTimer


# 累計時間(秒)の記録ファイルのパス
LOG_FILE = os.path.expanduser("~/wifi_usage_tracker/wifi_usage.log")
# ターゲットとするSSIDをここで指定してください
TARGET_SSID = "theBeatles"  # 例: "Free_WiFi" など

def get_current_ssid():
    """
    networksetup -listpreferredwirelessnetworks を使って
    2行目(先頭のPreferred networksの次の行)のSSIDを取得する
    """
    command = "networksetup -listpreferredwirelessnetworks en0 | sed -n '2p' | tr -d '\t'"
    result = subprocess.run(command, shell=True, capture_output=True, text=True)
    return result.stdout.strip()

def is_wifi_on():
    """
    networksetup -getairportpower en0 を用いてWi‑Fiの電源状態をチェックする
    出力に "On" が含まれていればWi‑Fiがオンと判断する。
    """
    command = "networksetup -getairportpower en0"
    result = subprocess.run(command, shell=True, capture_output=True, text=True)
    return "On" in result.stdout


"""
この下からグラフ化用スクリプト
"""
from datetime import datetime

HOURLY_LOG_DIR = os.path.expanduser("~/wifi_usage_tracker/logs")
os.makedirs(HOURLY_LOG_DIR, exist_ok=True)

SKIP_FLAG = os.path.expanduser("~/wifi_usage_tracker/skip_logging.flag")

def log_hourly_usage():
    # 👇 フラグファイルがあればスキップ
    if os.path.exists(SKIP_FLAG):
        return

    now = datetime.now()
    date_str = now.strftime("%Y-%m-%d")
    hour_str = now.strftime("%H")
    log_file = os.path.join(HOURLY_LOG_DIR, f"{date_str}.csv")

    # 初期化(0〜23時)
    hourly = {str(h).zfill(2): 0 for h in range(24)}
    if os.path.exists(log_file):
        with open(log_file, "r") as f:
            for line in f:
                h, s = line.strip().split(",")
                hourly[h] = int(s)

    # 今の時間帯に1秒加算
    hourly[hour_str] += 1

    # 上書き保存
    with open(log_file, "w") as f:
        for h in sorted(hourly.keys()):
            f.write(f"{h},{hourly[h]}\n")

"""
ここまでグラフ化用スクリプト
"""


class WiFiTimerApp:
    def __init__(self):
        self.app = QApplication(sys.argv)
        self.app.setQuitOnLastWindowClosed(False)

        # アイコンはwifi_usage_trackerフォルダにあるカスタムアイコンを指定。
        self.tray = QSystemTrayIcon(QIcon(os.path.expanduser("~/wifi_usage_tracker/wifi_icon.png")), self.app)
        self.menu = QMenu()

        # メニューバーに表示する項目(累計時間)
        self.timer_action = QAction("Wi-Fi使用時間: 0秒", self.menu)
        self.menu.addAction(self.timer_action)

        # リセット用項目
        self.reset_action = QAction("リセット", self.menu)
        self.reset_action.triggered.connect(self.reset_timer)
        self.menu.addAction(self.reset_action)

        self.tray.setContextMenu(self.menu)
        self.tray.show()

        # 1秒ごとに update_time() を呼び出すタイマー
        self.timer = QTimer()
        self.timer.timeout.connect(self.update_time)
        self.timer.start(1000)

        # 累計時間をログファイルから読み込む
        self.total_time = self.load_time()
        # ターゲットSSIDを定数から設定
        self.target_ssid = TARGET_SSID
        # 現在の日付 (YYYY-MM-DD形式) を保存
        self.current_date = self.get_date()
        print("Target SSID:", self.target_ssid)

    def get_date(self):
        """現在の日付(YYYY-MM-DD形式)を返す"""
        return time.strftime("%Y-%m-%d")

    def load_time(self):
        if os.path.exists(LOG_FILE):
            try:
                with open(LOG_FILE, "r") as f:
                    return int(f.read().strip())
            except Exception as e:
                print("読み込みエラー:", e)
                return 0
        return 0

    def save_time(self):
        with open(LOG_FILE, "w") as f:
            f.write(str(self.total_time))

    def update_time(self):
        # 毎秒、現在の日付をチェック。日付が変わっていれば累計時間をリセットする
        today = self.get_date()
        if today != self.current_date:
            self.total_time = 0
            self.save_time()
            self.current_date = today
            print("日付が変わったので累計時間をリセットしました。")

        current_ssid = get_current_ssid()
        print("Current SSID:", current_ssid)

        # Wi-Fiがオンで、かつ現在のSSIDがターゲットSSIDと一致していれば1秒分加算
        if is_wifi_on():
            if current_ssid == self.target_ssid:
                self.total_time += 1
                self.save_time()
                log_hourly_usage() #この一文はグラフ化用
        else:
            print("Wi-Fiがオフです。")

        # 累計時間を秒単位で表示
        self.timer_action.setText(f"Wi-Fi使用時間: {self.total_time}秒")

    def reset_timer(self):
        self.total_time = 0
        self.save_time()
        self.update_time()

    def run(self):
        sys.exit(self.app.exec_())

if __name__ == "__main__":
    app = WiFiTimerApp()
    app.run()
-
「wifi_timer.py」という名前にし、wifi_usage_trackerフォルダに保存する。

-
メニューバーに表示させたいアイコンを用意し、「wifi_icon.png」という名前で、同じくwifi_usage_trackerフォルダに保存する。

このアイコンはフリー素材を利用。URL:https://www.silhouette-illust.com/illust/48089 -
ユーザディレクトリに仮想環境を作成し、有効化する。ターミナルで以下を実行。
python3 -m venv ~/venv
source ~/venv/bin/activate


venvフォルダが作成される
- 仮想環境内でPyQT5をインストールする。ターミナルで以下を実行。
pip install PyQt5

- 作成した仮想環境内でpythonスクリプトを動かすよう指示を出すアプリケーションを作る。スクリプトエディタを開く。


以下のコードを入力する
do shell script "nohup /Users/katouyuudai/venv/bin/python3 /Users/katouyuudai/wifi_timer.py >/dev/null 2>&1 &"

ファイル形式をアプリケーションにして保存する。

- 作成したアプリケーションを開くと、pythonアプリが開き、作ったアプリ自体はすぐに終了する。メニューバーにアイコンが表示され、クリックすると秒数が出てくる。


- wifi_usage_trackerフォルダ内を確認すると、wifi_usage.logファイルとlogsフォルダが作成されている。wifi_usage.logファイルは、今日一日家Wi-Fiに繋がった時間を記録している場所である。中身を確認すると、家Wi-Fiに繋がっている場合、値が1秒ごとに増えていくのが確認できる。

logsフォルダは、時間帯別で記録された家Wi-Fi利用時間が、日ごとに別のファイルで保管されていく場所である。開くと、今日の日付がついたファイルが中に作成されているのが確認できる。

- pythonスクリプトを終了するために、終了指示用アプリケーションも作る。6と同様に、スクリプトエディタで新規書類を開き、今度は以下のコードを入力して保存する。
do shell script "pkill -f /Users/katouyuudai/wifi_usage_tracker/wifi_timer.py"

- 作成したアプリケーションを開いて、wifi_timer.pyを終了する。
「Wi-Fi/PC使用時間統計」アプリケーション実装手順
pc_usage_logger.py
- Pythonスクリプトを書く。
# pc_usage_logger.py
import os
import sys
import time
from datetime import datetime

LOCK_FILE = "/tmp/pc_usage_logger.lock"

# 別インスタンスが動いているか確認
def check_running_or_exit():
    if os.path.exists(LOCK_FILE):
        # ファイルはあるけどプロセスが死んでる場合を除外する
        try:
            with open(LOCK_FILE, "r") as f:
                pid = int(f.read().strip())
            # プロセスが実際に動いてるか確認
            os.kill(pid, 0)
            print("すでに実行中のため終了します")
            sys.exit()
        except Exception:
            print("ロックファイルはあるが、プロセスが存在しないため続行します")
    # ロックファイルを書き込む
    with open(LOCK_FILE, "w") as f:
        f.write(str(os.getpid()))

# 実行前にロック確認
check_running_or_exit()

# 後で cleanup も忘れずに!
import atexit
def remove_lock_file():
    if os.path.exists(LOCK_FILE):
        os.remove(LOCK_FILE)
atexit.register(remove_lock_file)


LOG_DIR = os.path.expanduser("~/wifi_usage_tracker/logs")
os.makedirs(LOG_DIR, exist_ok=True)

def get_current_log_path():
    return os.path.join(LOG_DIR, f"pc_{datetime.now().strftime('%Y-%m-%d')}.csv")

def is_awake():
    try:
        with open(os.path.expanduser("~/wifi_usage_tracker/screen_awake.flag"), "r") as f:
            return f.read().strip() == "awake"
    except FileNotFoundError:
        return False

SKIP_FLAG = os.path.expanduser("~/wifi_usage_tracker/skip_logging.flag")

def log_usage():

    # 👇 フラグファイルがあればスキップ
    if os.path.exists(SKIP_FLAG):
        return

    now = datetime.now()
    hour = now.strftime("%H")
    log_path = get_current_log_path()

    # 初期データは空
    data = {}

    # ファイルが存在すれば読み込む
    if os.path.exists(log_path):
        with open(log_path, "r") as f:
            for line in f:
                h, sec = line.strip().split(",")
                data[h] = int(sec)

    # 足りない時間帯をゼロで埋める
    for h in range(24):
        key = str(h).zfill(2)
        data.setdefault(key, 0)

    # 起きていれば1秒加算
    if is_awake():
        data[hour] += 1

    # 上書き保存
    with open(log_path, "w") as f:
        for h in sorted(data.keys()):
            f.write(f"{h},{data[h]}\n")

if __name__ == "__main__":
    while True:
        log_usage()
        time.sleep(1)
-
「pc_usage_logger.py」という名前にし、wifi_usage_trackerフォルダに保存する。

-
SleepwatcherでPC点灯状態を記録するためのファイルを作成する。ターミナルで以下を実行。
touch ~/wifi_usage_tracker/screen_awake.flag

wifi_usage_trackerフォルダ内に新しくファイルができる
- ~/.wakeup ファイルを作成(デフォルトで復帰時に起動するファイル)。ターミナルで以下を実行。
nano ~/.wakeup
エディタが開くため、中に以下を書き込んで保存(Control + X → 「保存しますか?」でY → 「ファイル名確認」でreturn)。
#!/bin/bash
echo "awake" > ~/wifi_usage_tracker/screen_awake.flag

実行権限を付与。ターミナルで以下を実行。
chmod +x ~/.wakeup

- ~/ .sleep ファイルも同じく作成(デフォルトでスリープ時に起動するファイル)。ターミナルで以下を実行。
nano ~/.sleep
エディタが開くため、中に以下を書き込んで保存(Control + X → 「保存しますか?」でY → 「ファイル名確認」でreturn)。③にて作った「スリープ時wifiオフ」アプリケーションで書き込んだ内容もあるので2行になる。
#!/bin/bash
echo "sleep" > ~/wifi_usage_tracker/screen_awake.flag
networksetup -setairportpower en0 off

実行権限を付与。ターミナルで以下を実行。
chmod +x ~/.sleep

- ここから、先ほどpythonスクリプトを動かすために作成した起動指示用アプリケーションに、pc_usage_logger.pyを動かすコードを追記する。スクリプトエディタで、起動指示用アプリケーションを開く。

以下のコードに書き換えて保存する。
do shell script "nohup /Users/katouyuudai/venv/bin/python3 /Users/katouyuudai/wifi_usage_tracker/wifi_timer.py >/dev/null 2>&1 &"
do shell script "nohup /Users/katouyuudai/venv/bin/python3 /Users/katouyuudai/wifi_usage_tracker/pc_usage_logger.py >/dev/null 2>&1 &"

display dialog "すべてのスクリプトを起動しました!" buttons {"OK"} default button 1

- 作成したアプリケーションを開くと、「すべてのスクリプトを起動しました!」というポップアップが表示される。wifi_timer.pyが開くのと同時に、裏でpc_usage_logger.pyが起動する。

logsフォルダ内を確認すると、「pc_今日の日付.csv」というファイルが追加されている。これはPC利用時間を時間帯別に記録したファイルで、wifi_timer.pyが作成するファイルと同じlogsフォルダに保管されるよう設定している。追加されていれば、動作が確認できたということになる。

- 終了指示用アプリケーションにも、pc_usage_logger.pyを終了するコードを追記する。スクリプトエディタで、終了指示用アプリケーションを開く。

以下のコードに書き換えて保存する。
do shell script "pkill -f /Users/katouyuudai/wifi_usage_tracker/wifi_timer.py"
do shell script "pkill -f /Users/katouyuudai/wifi_usage_tracker/pc_usage_logger.py"

display dialog "すべてのスクリプトを終了しました!" buttons {"OK"} default button 1

- 作成したアプリケーションを開き、2つのpythonスクリプトを閉じる。「すべてのスクリプトを終了しました!」というポップアップを確認する。

※pc_usage_logger.pyは、裏で動くプログラムなためわかりづらいが、二重に起動すると使用時間の記録が時々消滅してしまうというバグが生まれる。そのため、終了指示用アプリケーションで確実に終了した上で、起動指示用アプリケーションを一度だけクリックするよう注意してほしい。
app.py
- wifi_usage_trackerフォルダ内に「webapp」という名前のフォルダを作る。
- Pythonスクリプトを書く。
from flask import Flask, render_template, request
import os
from datetime import datetime
from collections import defaultdict


app = Flask(__name__)
LOG_DIR = os.path.expanduser("~/wifi_usage_tracker/logs")

# 共通処理: 日付一覧取得

def get_all_dates():
    all_files = sorted([f for f in os.listdir(LOG_DIR) if f.endswith(".csv") and not f.startswith(".")])
    all_dates = set()
    for fname in all_files:
        base = fname[3:] if fname.startswith("pc_") else fname
        try:
            date = datetime.strptime(base[:-4], "%Y-%m-%d")
            all_dates.add(date)
        except ValueError:
            continue
    return sorted(all_dates)

# -------------------- 時間帯別ページ --------------------

@app.route("/")
def hourly_view():
    sorted_dates = get_all_dates()
    files = [f"{d.strftime('%Y-%m-%d')}.csv" for d in sorted_dates]
    selected_file = request.args.get("file", files[-1] if files else None)

    hours = [f"{str(h).zfill(2)}:00" for h in range(24)]
    minutes, log_data = [], {}
    now = datetime.now()
    selected_date = selected_file[:-4] if selected_file else None
    is_today = selected_date == now.strftime("%Y-%m-%d")

    log_path = os.path.join(LOG_DIR, selected_file) if selected_file else None
    if log_path and os.path.exists(log_path):
        with open(log_path, "r") as f:
            for line in f:
                hour, sec = line.strip().split(",")
                log_data[hour] = int(sec)

    for h in range(24):
        key = str(h).zfill(2)
        if not is_today or h <= int(now.strftime("%H")):
            minutes.append(round(log_data.get(key, 0) / 60, 2))
        else:
            minutes.append(None)

    # PCログ
    pc_hourly_minutes = []
    pc_path = os.path.join(LOG_DIR, f"pc_{selected_date}.csv") if selected_date else None
    if pc_path and os.path.exists(pc_path):
        pc_data = {f"{str(h).zfill(2)}": 0 for h in range(24)}
        with open(pc_path, "r") as f:
            for line in f:
                h, sec = line.strip().split(",")
                pc_data[h] = int(sec)
        pc_hourly_minutes = [round(pc_data[str(h).zfill(2)] / 60, 2) for h in range(24)]
    else:
        pc_hourly_minutes = [None] * 24

    return render_template("hourly.html",
                           hours=hours,
                           minutes=minutes,
                           pc_hourly_minutes=pc_hourly_minutes,
                           date=selected_date,
                           files=files,
                           selected_file=selected_file)

# -------------------- 日別ページ --------------------

@app.route("/daily")
def daily_view():
    sorted_dates = get_all_dates()
    files = [f"{d.strftime('%Y-%m-%d')}.csv" for d in sorted_dates]
    selected_file = request.args.get("file", files[-1] if files else None)
    selected_date = selected_file[:-4] if selected_file else None

    # 週情報構築
    weekly_files = defaultdict(list)
    for d in sorted_dates:
        y, w, _ = d.isocalendar()
        weekly_files[f"{y}-W{str(w).zfill(2)}"].append(d)

    selected_week = request.args.get("week")
    if not selected_week and selected_date:
        try:
            dt = datetime.strptime(selected_date, "%Y-%m-%d")
            y, w, _ = dt.isocalendar()
            selected_week = f"{y}-W{str(w).zfill(2)}"
        except:
            selected_week = sorted(weekly_files.keys())[-1]
    if not selected_week:
        selected_week = sorted(weekly_files.keys())[-1]

    daily_labels, daily_totals, daily_pc_totals = [], [], []

    for d in sorted(weekly_files[selected_week]):
        fname = f"{d.strftime('%Y-%m-%d')}.csv"
        path = os.path.join(LOG_DIR, fname)
        total_sec = 0
        if os.path.exists(path):
            with open(path, "r") as f:
                for line in f:
                    parts = line.strip().split(",")
                    if len(parts) == 2:
                        _, sec = parts
                        total_sec += int(sec)
        daily_labels.append(d.strftime("%m/%d"))
        daily_totals.append(round(total_sec / 60, 2))

        pc_path = os.path.join(LOG_DIR, f"pc_{fname}")
        pc_sec = 0
        if os.path.exists(pc_path):
            with open(pc_path, "r") as f:
                for line in f:
                    parts = line.strip().split(",")
                    if len(parts) == 2:
                        _, sec = parts
                        pc_sec += int(sec)
        daily_pc_totals.append(round(pc_sec / 60, 2))

    while len(daily_labels) < 7:
        daily_labels.append("")
        daily_totals.append(None)
        daily_pc_totals.append(None)

    return render_template("daily.html",
                           daily_labels=daily_labels,
                           daily_totals=daily_totals,
                           daily_pc_totals=daily_pc_totals,
                           weekly_files=weekly_files,
                           selected_week=selected_week,
                           files=files,
                           selected_file=selected_file)

if __name__ == "__main__":
    app.run(debug=True)
-
「app.py」という名前にし、webappフォルダに保存する。

-
webappフォルダ内に「templates」という名前のフォルダを作る。
-
htmlコードを書く。
<!DOCTYPE html>
<html>
<head>
    <meta charset="utf-8">
    <title>Wi-Fi・PC 時間帯統計</title>
    <script src="https://cdn.jsdelivr.net/npm/chart.js"></script>
    <script src="https://cdn.jsdelivr.net/npm/chartjs-plugin-annotation@1.4.0"></script>
    <style>
        body {
            font-family: -apple-system, BlinkMacSystemFont, "Segoe UI", Roboto, "Helvetica Neue", sans-serif;
            margin: 2em;
            background-color: #f9f9f9;
            color: #333;
        }
        h2 {
            margin-top: 2em;
            color: #444;
        }
        select {
            padding: 6px 12px;
            font-size: 14px;
        }
        .bottom-static-nav {
            text-align: right;
            margin-top: 40px;
            margin-bottom: 20px;
            padding-right: 30px;
        }

    </style>
</head>
<body>

<form method="get">
    <label>日付を選択:</label>
    <select name="file" onchange="this.form.submit()">
        {% for file in files %}
        <option value="{{ file }}" {% if file == selected_file %}selected{% endif %}>
            {{ file[:-4] }}
        </option>
        {% endfor %}
    </select>
</form>

<div style="background:#fff; box-shadow:0 2px 8px rgba(0,0,0,0.1); padding:30px 20px 20px 20px; border-radius:30px; margin-bottom:20px;">
    <h2 style="margin-top: 0; margin-bottom: 0.7em;">🛜 時間帯別指定Wi-Fi使用時間(分)</h2>
    <canvas id="wifiChart" width="800" height="400"></canvas>
</div>
<script>
    const wifiCtx = document.getElementById('wifiChart').getContext('2d');
    const wifiChart = new Chart(wifiCtx, {
        type: 'bar',
        data: {
            labels: {{ hours | tojson }},
            datasets: [{
                label: '使用時間(分)',
                data: {{ minutes | tojson }},
                backgroundColor: 'rgba(75, 192, 192, 0.3)',
                borderColor: 'rgba(75, 192, 192, 1)',
                borderWidth: 1
            }]
        },
        options: {
            scales: { y: { beginAtZero: true } },
            plugins: {
                annotation: {
                    annotations: {
                        line30min: {
                            type: 'line', yMin: 30, yMax: 30,
                            borderColor: 'rgba(255, 99, 132, 0.6)',
                            borderWidth: 2,
                            label: {
                                enabled: true,
                                backgroundColor: 'rgba(255,99,132,0.2)'
                            }
                        }
                    }
                }
            }
        }
    });
</script>

<div style="background:#fff; box-shadow:0 2px 8px rgba(0,0,0,0.1); padding:30px 20px; border-radius:30px; margin-bottom:20px;">
    <h2 style="margin-top: 0; margin-bottom: 0.7em;">💻 時間帯別 PC 使用時間(分)</h2>
    <canvas id="pcHourlyChart" width="800" height="400"></canvas>
</div>
<script>
    const pcCtx = document.getElementById('pcHourlyChart').getContext('2d');
    const pcChart = new Chart(pcCtx, {
        type: 'bar',
        data: {
            labels: {{ hours | tojson }},
            datasets: [{
                label: 'PC使用時間(分)',
                data: {{ pc_hourly_minutes | tojson }},
                backgroundColor: 'rgba(153, 102, 255, 0.4)',
                borderColor: 'rgba(153, 102, 255, 1)',
                borderWidth: 1
            }]
        },
        options: {
            scales: { y: { beginAtZero: true } },
            plugins: {
                annotation: {
                    annotations: {
                        line60min: {
                            type: 'line', yMin: 60, yMax: 60,
                            borderColor: 'rgba(210, 210, 210, 0.6)',
                            borderWidth: 2,
                            label: {
                                enabled: true,
                                backgroundColor: 'rgba(210,210,210,0.2)'
                            }
                        }
                    }
                }
            }
        }
    });
</script>
<nav class="bottom-static-nav">
  <a href="/daily" target="_blank">日別></a>
</nav>
</body>
</html>
-
「hourly.html」という名前にし、templatesフォルダに保存する。
-
もう一つ別のhtmlコードを書く。
<!DOCTYPE html>
<html>
<head>
    <meta charset="utf-8">
    <title>Wi-Fi・PC 日別統計</title>
    <script src="https://cdn.jsdelivr.net/npm/chart.js"></script>
    <script src="https://cdn.jsdelivr.net/npm/chartjs-plugin-annotation@1.4.0"></script>
    <style>
        body { font-family: -apple-system, BlinkMacSystemFont, "Segoe UI", Roboto, "Helvetica Neue", sans-serif; margin: 2em; background-color: #f9f9f9; color: #333; }
        h2 { margin-top: 2em; color: #444; }
        select { padding: 6px 12px; font-size: 14px; }
    </style>
</head>
<body>
<form method="get">
    <label>週を選択:</label>
    <select name="week" onchange="this.form.submit()">
        {% for w in weekly_files.keys()|sort %}
        <option value="{{ w }}" {% if w == selected_week %}selected{% endif %}>{{ w }}</option>
        {% endfor %}
    </select>
</form>

<div style="background:#fff; box-shadow:0 2px 8px rgba(0,0,0,0.1); padding:30px 20px 20px 20px; border-radius:30px; margin-bottom:20px;">
    <h2 style="margin-top: 0; margin-bottom: 0.7em;">指定Wi-Fi使用時間合計(分)</h2>
    <canvas id="dailyChart" width="800" height="400"></canvas>
</div>
<script>
    const ctxWifi = document.getElementById('dailyChart').getContext('2d');
    const dailyChart = new Chart(ctxWifi, {
        type: 'bar',
        data: {
            labels: {{ daily_labels | tojson }},
            datasets: [{
                label: '使用時間(分)',
                data: {{ daily_totals | tojson }},
                backgroundColor: 'rgba(255, 99, 132, 0.4)',
                borderColor: 'rgba(255, 99, 132, 1)',
                borderWidth: 1
            }]
        },
        options: {
            scales: { y: { beginAtZero: true } },
            plugins: {
                annotation: {
                    annotations: {
                        line30min: {
                            type: 'line', yMin: 30, yMax: 30,
                            borderColor: 'rgba(255, 99, 132, 0.6)',
                            borderWidth: 2,
                            label: {
                                enabled: true,
                                backgroundColor: 'rgba(255,99,132,0.2)'
                            }
                        }
                    }
                }
            }
        }
    });
</script>

<div style="background:#fff; box-shadow:0 2px 8px rgba(0,0,0,0.1); padding:30px 20px; border-radius:30px; margin-bottom:20px;">
    <h2 h2 style="margin-top: 0; margin-bottom: 0.7em;">PC使用時間合計(分)</h2>
    <canvas id="dailyPcChart" width="800" height="400"></canvas>
</div>
<script>
    const ctxPc = document.getElementById('dailyPcChart').getContext('2d');
    const dailyPcChart = new Chart(ctxPc, {
        type: 'bar',
        data: {
            labels: {{ daily_labels | tojson }},
            datasets: [{
                label: 'PC使用時間(分)',
                data: {{ daily_pc_totals | tojson }},
                backgroundColor: 'rgba(153, 102, 255, 0.4)',
                borderColor: 'rgba(153, 102, 255, 1)',
                borderWidth: 1
            }]
        },
        options: {
            scales: { y: { beginAtZero: true } }
        }
    });
</script>
</body>
</html>
-
「Daily.html」という名前にし、templatesフォルダに保存する。

-
pythonスクリプトを動かすための起動指示用アプリケーションに、app.pyを動かすコードを追記する。スクリプトエディタで、起動指示用アプリケーションを開く。

以下のコードに書き換えて保存する。
do shell script "nohup /Users/katouyuudai/venv/bin/python3 /Users/katouyuudai/wifi_usage_tracker/wifi_timer.py >/dev/null 2>&1 &"
do shell script "nohup /Users/katouyuudai/venv/bin/python3 /Users/katouyuudai/wifi_usage_tracker/pc_usage_logger.py >/dev/null 2>&1 &"
do shell script "nohup /Users/katouyuudai/venv/bin/python3 /Users/katouyuudai/wifi_usage_tracker/webapp/app.py >/dev/null 2>&1 &"

display dialog "すべてのスクリプトを起動しました!" buttons {"OK"} default button 1

-
作成したアプリケーションを開くと、「すべてのスクリプトを起動しました!」というポップアップが表示される。wifi_timer.py、pc_usage_logger.py、app.pyが起動する。
-
ブラウザで「http://127.0.0.1:5000」にアクセスする。すると、「🛜 時間帯別ターゲットWi-Fi使用時間(分)」と「💻 時間帯別 PC 使用時間(分)」の棒グラフが載ったページが表示される。

-
ページ下部の「日別>」ボタンをクリックする。すると、「ターゲットWi-Fi使用時間合計(分)」と「PC使用時間合計(分)」の棒グラフが載ったページが表示される。
-
pythonスクリプト終了指示用アプリケーションに、app.pyを終了するコードを追記する。スクリプトエディタで、終了指示用アプリケーションを開く。

以下のコードに書き換えて保存する。
do shell script "pkill -f /Users/katouyuudai/wifi_usage_tracker/wifi_timer.py"
do shell script "pkill -f /Users/katouyuudai/wifi_usage_tracker/pc_usage_logger.py"
do shell script "pkill -f /Users/katouyuudai/wifi_usage_tracker/webapp/app.py"

display dialog "すべてのスクリプトを終了しました!" buttons {"OK"} default button 1

- 作成したアプリケーションを開くと、「すべてのスクリプトを終了しました!」というポップアップが表示される。wifi_timer.py、pc_usage_logger.py、app.pyが終了する。
おまけ:アプリケーション見栄え調整
-
スクリプトエディタで作成した起動指示用アプリケーション、終了指示用アプリケーションのアイコンを変える。ファイルにカーソルを合わせて右クリックし、「情報を見る」を選択。

-
挿入したい画像をコピーし、出てきたウィンドウ内にあるアイコンのところを選択した状態でペースト(command+V)する。


終了指示用アプリケーションにも、同じく画像を貼り付ける。


ご自由にお使いください。
- 「http://127.0.0.1:5000」にアクセスする際、ウィンドウサイズを指定してブラウザを開きたいため、ウィンドウサイズ指定ブラウザ起動用アプリケーションもapplescriptで作る。スクリプトエディタで新規書類を開き、以下のコードを入力して保存する。(Brave Browserのところは、SafariやChromeなど好きなブラウザを指定すればよい。私はこのアプリを開く専用として、インストールしたもののほとんど使っていなかったブラウザを用いているだけである。)
tell application "Brave Browser"
	activate
	open location "http://127.0.0.1:5000"
	delay 0.5
	set bounds of front window to {860, 50, 1440, 1000}
end tell


開くとウィンドウ右に縦長で表示される。使っているディスプレイの解像度によって、{860, 50, 1440, 1000}の部分で数値の変更が必要なため、参考にする人は各自調整が必要である。
- ウィンドウサイズ指定ブラウザ起動用アプリケーションのアイコンを変える。


ご自由にお使いください。
次回について
これで、WiFiとPCの使用時間をいつでも振り返れるようになる。記録を手がかりに、1時間のWi-Fi使用を有意義に使えるようにしたい。
次は翻って、Wi-Fiをあえて使い切ることで、他のことに集中できるようにしたアプリケーションである。
Discussion